

“The right to be seen, the right to be heard, the right to direct the course of history, are markers of power.”
Stacy Abrams
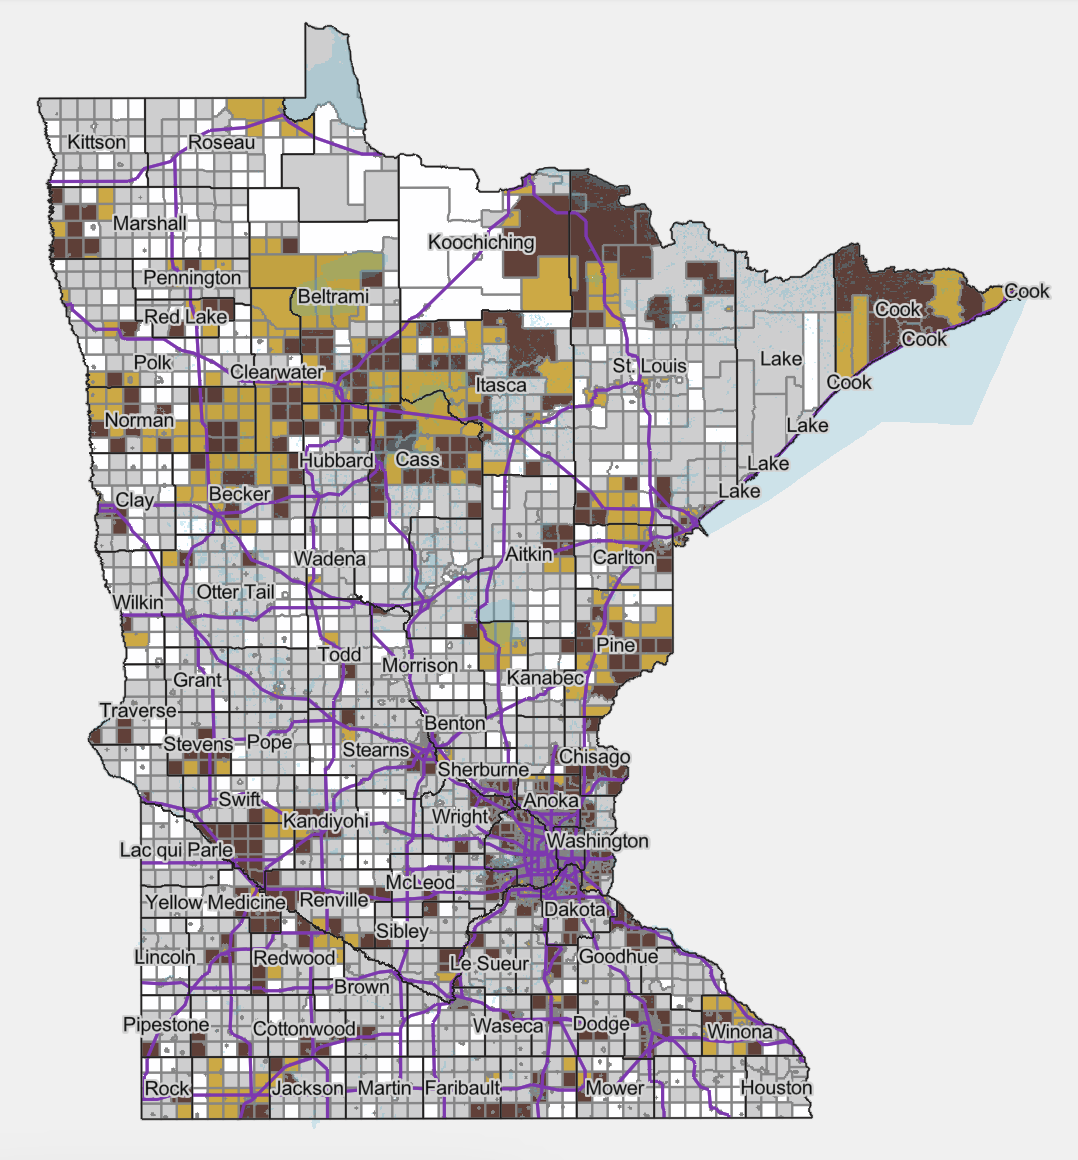
Our Power, Our Democracy Map
-
Built on a foundation of stolen land and labor, the U.S. was shaped for generations by the vision and voting of predominantly wealthy white men. From 19th Century laws that explicitly barred Black people from the polls to the racially targeted voting requirements in many states today, casting a ballot remains a privilege not a right for many Black, Indigenous, and people of color (BIPOC) communities.
And yet, we know racial justice is the work of generations. Our BIPOC ancestors fought for our right to vote because participation and self-determination are critical steps toward our liberation. We all deserve the right to influence and elect leaders who make decisions that impact our daily lives—from having clean air to breathe to having dignified housing for our families. And history has proven again and again that when BIPOC communities mobilize around our interests and our visions, we have the collective power to create change.
That’s why voter suppression continues today. Like the generations of wealthy white men before them, prejudiced political and corporate interests want to silence our voices to maintain unjust systems that extract profit from our oppression. But, like the movements before us, we continue to dismantle their barriers, amplify BIPOC voices and reclaim power everywhere we can to shape our own futures.
At Voices for Racial Justice, we recognize that voting is one way, among many, to ignite our solidarity and engage our communities to take action. We hope this project helps to move us closer to a true democracy — one centered on and defined by racial justice — by growing the capacity of community organizations to engage BIPOC residents this election season and beyond.
While Black, Indigenous and people of color (BIPOC) leaders and organizations across Minnesota are committed to breaking down barriers and turning out the vote in their communities, they lack important data to support their efforts. Today in Minnesota, the Secretary of State does not collect race and ethnicity in voter registration, so we DO NOT know what percentage of voters are BIPOC.
The Our Power, Our Democracy map seeks to narrow this information gap by combining two important types of data:
the percentage of voters who cast a ballot in the last election
the racial demographics of the people who live in that precinct
While these maps do NOT show BIPOC voter turnout, it gives us a sense of what communities have the highest number of potential BIPOC voters — and the greatest potential to turn up our BIPOC power at the ballot box through targeted engagement.
Click the map image or the button below to use the map!

Who Created This Map?
This map was created by a partnership of
Voices For Racial Justice
Minnesota Council of Foundations
Minnesota American Community Survey
Center for Urban and Regional Affairs (CURA) at the University of Minnesota
We partnered with Minnesota Compass to gather the information from the American Community Survey 5-year estimates (2017-2021), redistricting data from the 2020 Census (PL-94-171) and 2022 voter turnout data from the Minnesota Secretary of State's office.
Ultimately, this map is not a solution but an interim step that we hope will showcase the need for the Minnesota Secretary of State to collect detailed data on voter demographics — and make that information easily accessible to everyone.
Read more about this partnership here.
Who is This Map For?
Black, Indigenous and people of color (BIPOC) organization engaged in electoral activities
These maps are designed for you! Our goal is that you can use the voter turnout and detailed demographic information for each precinct in Minnesota to make your grassroots education and mobilization efforts more effective and powerful.
Funders and philanthropy that work with grassroots BIPOC organizers
We hope you will share this map with grantees or affiliates who can use it in positive ways to increase BIPOC participation in elections and other organizing efforts.
Community Engagement in Action
Map User Commitments
Throughout history, data has been weaponized against our communities, used to target our people for intimidation, discrimination and exclusion. By using this map, we ask that you first commit to the following agreements:
-
Recognize and consider the disproportionate civic engagement of communities based on race, ethnicity, country of origin and language — and how this impacts our democracy
-
Use and share the map to contribute positively to the participation of BIPOC communities in electoral and other power building activities — and value and honor the individuals represented by the data, avoiding dehumanization
-
Ensure fairness and non-discrimination in your use of the map. Be clear about the map lacking some critical data that may impact its accuracy, and margins of error
-
Be transparent about how the map will be used and the intended impact of your activities, and take responsibility for its proper handling and use
-
Underscore that this map is a temporary step toward accurately understanding voter demographics, and, ultimate, we need the Secretary of State to collect and report better data to understand BIPOC community voting
How to Use the Map
To use the maps, consider the following:
WHO do you want to engage? Are you interested in mobilizing Black people? Members of the Latin or Asian community? or Native? If you’re focused on a specific demographic, you can choose that specific map. If you’re focused on BIPOC communities more broadly, you can choose that map.
WHERE do you want to engage people? Is it a particular city? County? Region of Minnesota? If you’re focused on a specific area, you can zoom into that area on the map and click the different precincts. You’ll be able to see the voter turnout and the percentage of BIPOC residents or the particular population you’re interested in each precinct.
How can this information inform your civic engagement STRATEGIES , like where to doorknock or where to host events? We called this map Our Power, Our Democracy because we hope this resource will make it easy to identify where there is:
Potential BIPOC power: High % of BIPOC residents and low voter turnout %
Engaged BIPOC power: High % of BIPOC residents and high voter turnout %
Sources of data
The information in this map comes from the American Community Survey 5-year estimates (2017-2021), redistricting data from the 2020 Census (PL-94-171) and 2022 voter turnout data from the Minnesota Secretary of State's office.
Trainings
To support organizations in using the Our Power, Our Democracy map in their get-out-the-vote (GOTV) efforts in BIPOC communities, we have created two different types of trainings. If you’re interested in scheduling a training, please contact Nicole Donoso at donoso@voicesforracialjustice.org!
Deep Dive Training
(90 minutes)
In these customized sessions for specific organizations, we train participants on how to use the map, how to download relevant data, and engage in discussions about what the data reveals and its potential applications. So far we’ve trained organizations like African Career, Education and Resource Inc, ACLU of Minnesota, Minnesota Youth Collective, the Coalition of Asian American Leaders, and Fe Y Justicia Minnesota.
Overview Presentation
(60 minutes)
We also provide shorter presentations designed for larger, multi-organization gatherings that provide a high-level overview of the map. So far we’ve connected with organizations like T.O.N.E U.P, Grassroots In Action, Minneapolis NAACP, Somali Youth & Family Development Center, ISAIAH, HACER, CAPI, Greater Twin Cities United Way, Scrap Racism and the Minnesota Council on Latino Affairs.
Organizations we've engaged
-
![]()
African Career, Education and Resource Inc
-
![]()
ACLU of Minnesota
-
![]()
Minnesota Youth Collective
-
![]()
Coalition of Asian American Leaders
-
![]()
Fe Y Justicia Minnesota
-
![]()
T.O.N.E. U.P.
-
![]()
Grassroots in Action
-
![]()
Minneapolis NAACP
-
![]()
Somali Youth and Family Development Center
-
![]()
ISAIAH
-
![]()
CAPI
-
![]()
Greater Twin Cities United Way
-
![]()
Pohlad Family Foundation
-
![]()
Minnesota Council on Latino Affairs
-
![]()
HACER


Contact us!
Interested in partnering with us to expand democracy and civic engagement?
Contact Nicole Donoso: donoso@voicesforracialjustice.org
This map was created using publicly available information on voter turnout and is being made available as a free public resource on a nonpartisan basis. Charitable organizations described in Section 501(c)(3) of the Internal Revenue Code who are interested in using the map to inform their voter education and civic engagement activities should ensure that their proposed uses are consistent with their tax-exempt status and their classification as a public charity or private foundation and should consult with knowledgeable legal counsel as necessary. A free resource for 501(c)(3) organizations highlighting some of the primary legal considerations for voter engagement and registration activities may be found here.